|
|
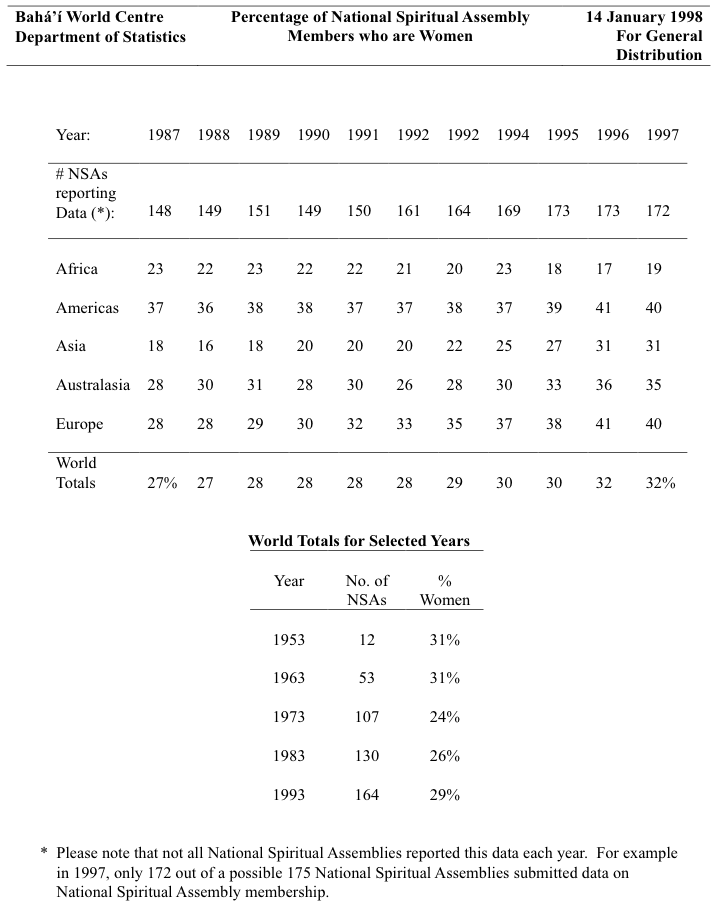
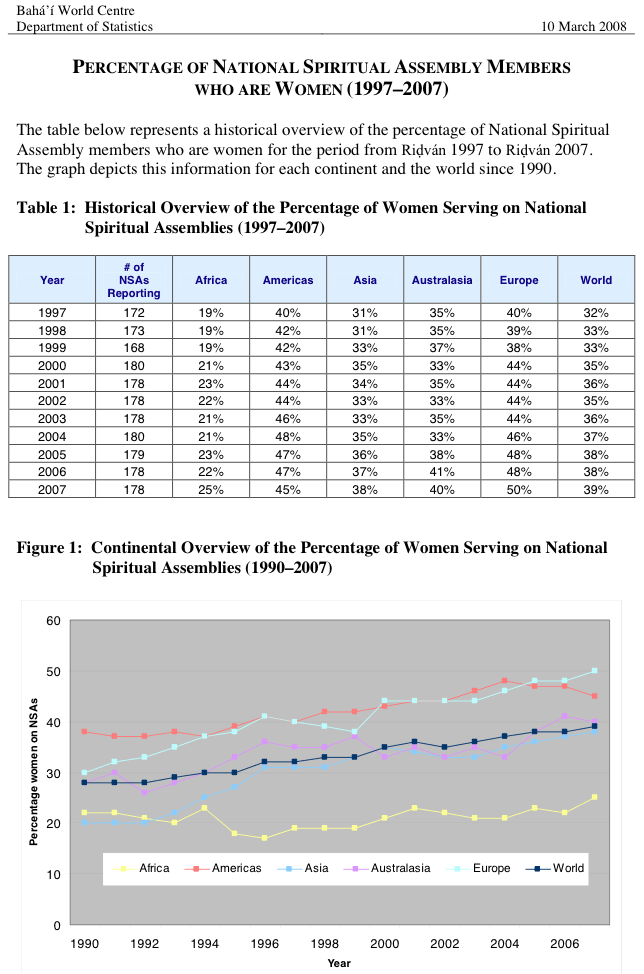
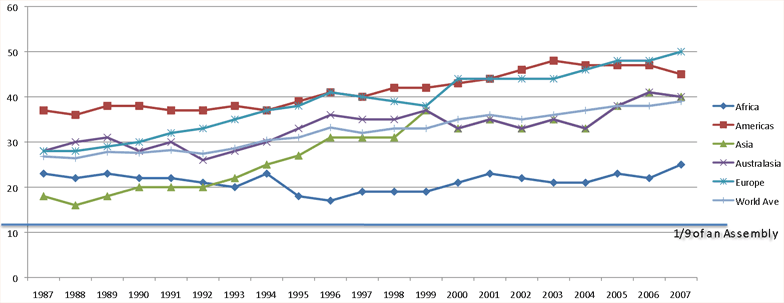
Abstract: Two letters from the House, with attached tables, showing the number of women serving on NSAs 1953-1993, 1987-1997, and 1997-2007. Includes graphs showing numbers and percent of women serving on NSAs by continental region. Notes: Both letters transmitted by email and posted with permission of recipient. The first three tables and graphs below were prepared by the Bahá'í World Centre Department of Statistics and enclosed with the emails. The bottom two graphs were prepared by Steven Kolins for posting at en.wikipedia.org/wiki/Bahá'í_Faith_and_gender_equality, 2010-08. See also Percentage of Women Serving as Continental Counselors or in the International Teaching Centre and statistics in Sexual Equality in the Bahá'í Community, and timeline of members of the House of Justice. |
National Spiritual Assembly members who are women, Percentage of, 1953-2007
by Bahá'í World Centre
1998/20083 February 1998
Dear Bahá’í Friend,
Your email of 8 January 1998, requesting updated information about the percentage of National Spiritual Assembly members who are women, has been received at the Bahá’í World Centre.
Please find enclosed a table showing historical information, similar to the one previously sent to you, but updated to 1997. Also enclosed is our letter to you of 12 June 1996 [not included here].

10 March 2008
Dear Bahá’í Friend,
Your email message of 20 November 2006 requesting updated information about the percentage of National Spiritual Assembly members who are women has been received at the Bahá’í World Centre and referred to our Department for response. We deeply regret the long delay that has occurred in responding to you.
We are pleased to enclose a document with a table providing historical data from 1997 and a graph depicting similar information for each continent of the world from 1990. Also enclosed is our letter to you of 3 February 1998, with enclosure, as requested by you. We hope you find the information useful.

click for larger image

click for larger image

click for larger image
Dear Bahá’í Friend,
Your email of 8 January 1998, requesting updated information about the percentage of National Spiritual Assembly members who are women, has been received at the Bahá’í World Centre.
Please find enclosed a table showing historical information, similar to the one previously sent to you, but updated to 1997. Also enclosed is our letter to you of 12 June 1996 [not included here].
- With loving Bahá’í greetings,
For the Department of Statistics
- [Note: the table below lists 1992 twice; the second one is presumably a typo for '1993.']

10 March 2008
Dear Bahá’í Friend,
Your email message of 20 November 2006 requesting updated information about the percentage of National Spiritual Assembly members who are women has been received at the Bahá’í World Centre and referred to our Department for response. We deeply regret the long delay that has occurred in responding to you.
We are pleased to enclose a document with a table providing historical data from 1997 and a graph depicting similar information for each continent of the world from 1990. Also enclosed is our letter to you of 3 February 1998, with enclosure, as requested by you. We hope you find the information useful.
- With loving Bahá’í greetings,
Department of Statistics

Percent of women serving on NSAs by continental region, 1953-2007

click for larger image
Percent of women serving by continental region, detail: 1987-2007

click for larger image
Worldwide number of women serving on NSAs, 1953-2007

click for larger image
|
|